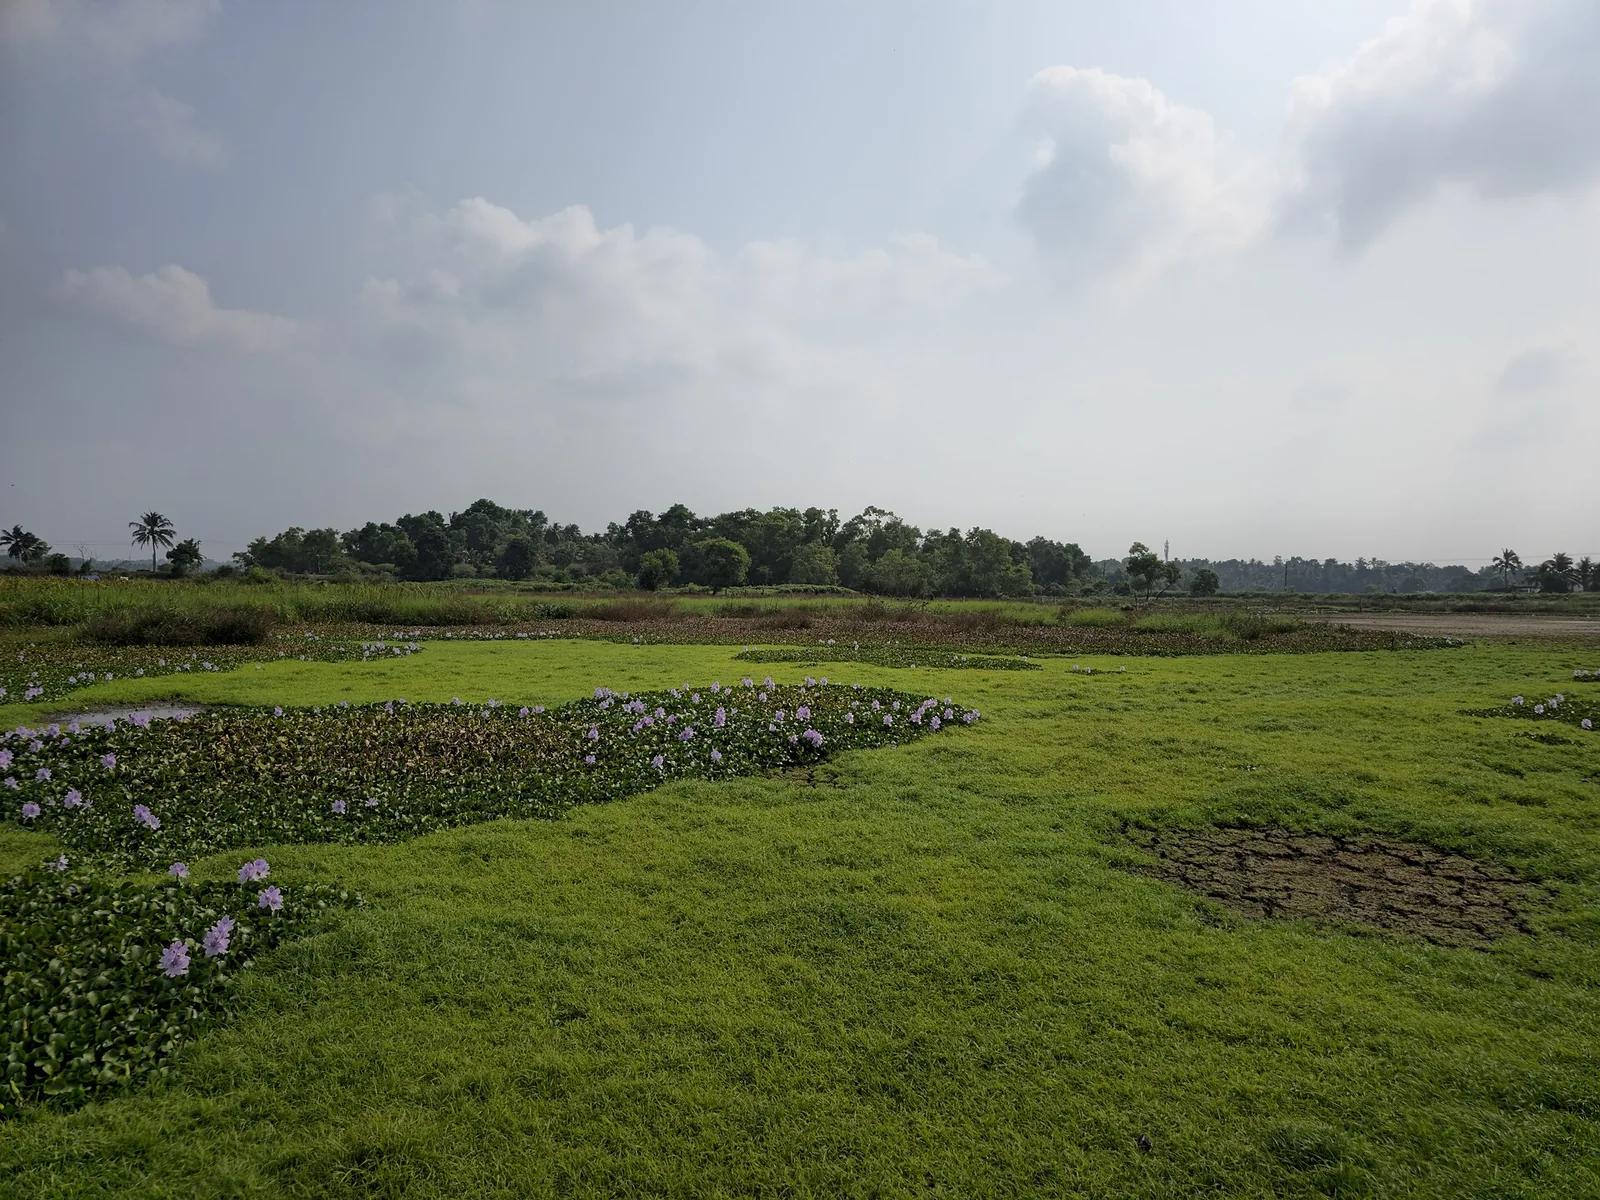
Imagine two views of Vellayani Lake from above. In the first, from 1973, researchers mapped 558.93 hectares of open water. In the second, from 2011, they mapped 243.39. The 2017 study by Vijayan, Radhakrishnan and Job puts the difference at roughly 56%. What happened between those frames, and what can they actually tell us about the lake seen today?
The years between the frames
The paper used satellite images from February 1973, March 1992, September 2001 and March 2011 to map changes in the lake’s open-water extent. Image date matters: a monsoon-period image and a dry-season image can show different waterlines even without a permanent change. The long-term reduction reported by the authors is substantial, but the number for any single year belongs to its image and mapping method.
The edge the camera cannot define
A measured open-water polygon does not include every seasonal marsh, paddy field or adjoining wet ground. It also is not automatically the legal boundary of a protected wetland. That is why a later newspaper number or a government area estimate cannot simply be attached to the paper’s 1973 starting point to calculate a new percentage. Use a consistent series when comparing change.
The suspects, and the missing proof
The authors discuss reclamation, encroachment, sand mining, pollution, population growth and urbanisation as pressures on the lake ecosystem. The satellite comparison measures area; by itself it does not apportion each lost hectare to one cause or prove that every green margin visible today was once open water. Field surveys and land records are needed for that more precise account.
What the next frame needs to show
Vellayani is a freshwater lake with irrigation, habitat and water-supply roles. The Kerala Centre for Water Resources Development and Management lists work on its conservation and protection. The satellite result supplies a documented baseline for asking whether restoration protects open water and surrounding wetland. It does not replace current survey data or a current water-quality result.
The story stops at the last image the researchers used. A current survey, with the same boundary and an explained season, could add the next frame and test what changed after 2011. Until then, the measured loss is historical context for a visit, not the lake’s present area. Stay on permitted paths and respect posted notices. The separate Vizhinjam water story follows the port’s supply plans without assigning this earlier loss to port demand.
The next photograph would need the same rules
A new satellite image might look like an easy update to the study. It would only be comparable if researchers used a similar boundary method and accounted for season and water level. Open water can vary during a year, while marsh and cultivated wetland may be excluded from a water polygon even when they remain part of the lake’s ecological edge.
The port water-plan story raises a separate, later question about supply. It should not be retrofitted as the cause of changes seen between 1973 and 2011. Keeping the timelines apart protects both stories from an easy but misleading explanation.
The four frames give Vellayani a documented past. A well designed fifth frame could tell us what happened next, and perhaps which pressures mattered most.
Frequently asked questions
How much open water did the study find?
The 2017 remote-sensing paper reports 558.93 hectares in its 1973 image and 243.39 hectares in its 2011 image, a decline of about 56% within that study.
Is 243.39 hectares the lake’s size now?
No. It is the open-water area mapped from a March 2011 image. A current area needs a current survey with a clearly defined boundary.
Does the study prove why each part of the lake changed?
No. It maps open-water change and discusses several pressures. Assigning a particular patch of change to one cause requires additional local evidence.
Why do other published lake-area figures differ?
They may use different dates, seasons and boundaries, and some describe the whole wetland rather than open water. Compare like with like before calculating a trend.